
Factsheet on Mumbai – II
Crimes in your region versus the Questions your MLAs are asking on them!
Do you think the MLAs from your regions are asking the big questions with regard to crimes in your area?
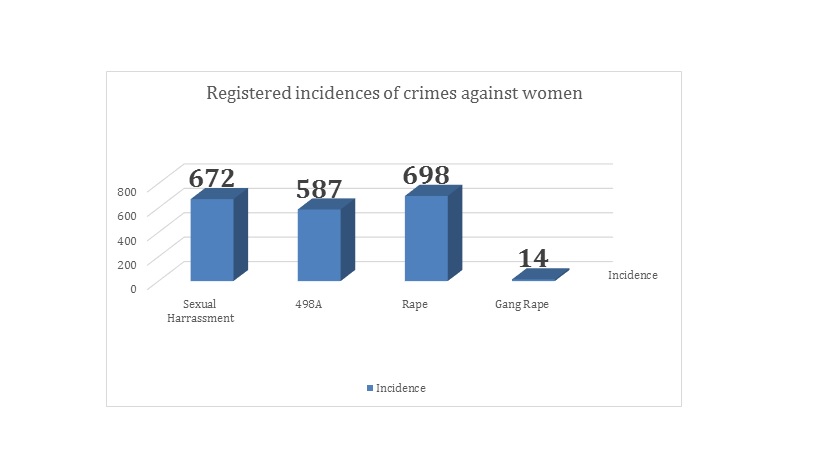
Crime Statistics – Crimes Against Women
Crime against women in Mumbai have increased since 2012, but the conviction rate for these crimes remains low. According to the Praja report, between 2012 to 2017, reported cases of rape increased by 96%, and reported cases of molestation increased by 165%. However, rape reporting in Mumbai dropped by 21% between 2016 and 2017.
According to the NCRB 2016 report, the total IPC & SLL (Special Acts and Local Laws) crimes against women was 5128, which put Mumbai right behind Delhi among the 19 cities.
Regional Data – Specific Crimes Heads (2016 – 2017)
In the state of policing report, Praja recorded the number of questions MLAs from each region asked on specific crimes. Here’s a comparison of the figures of the crime in your area juxtaposed with the number of questions that the MLAs raised on the topic last year.
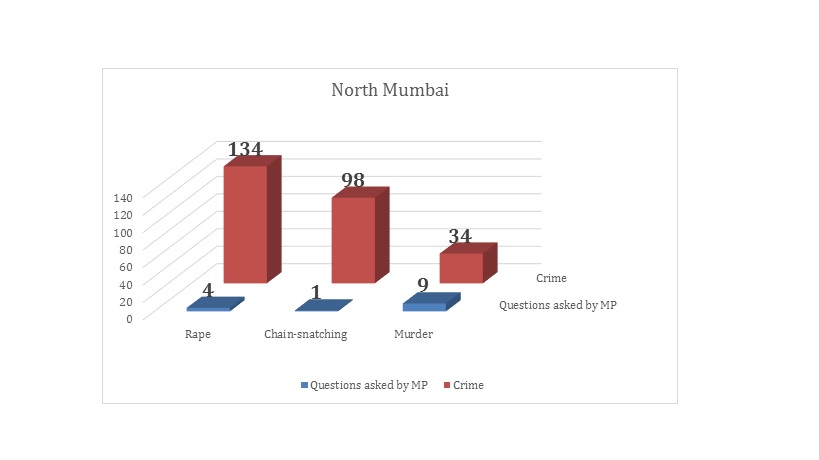
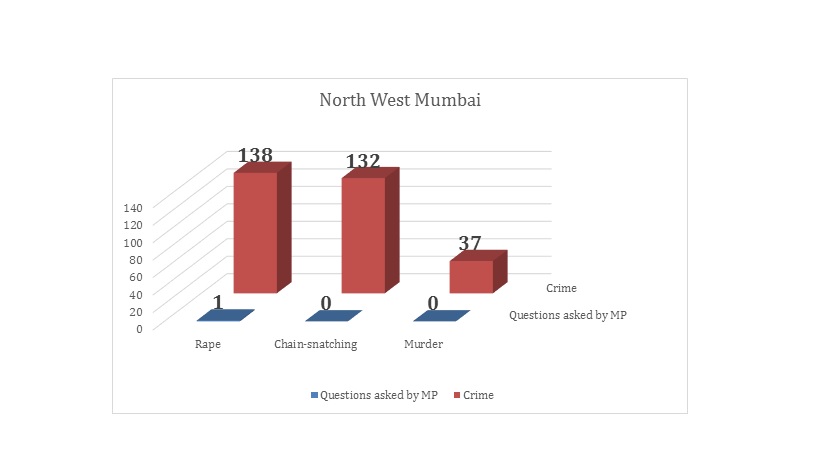

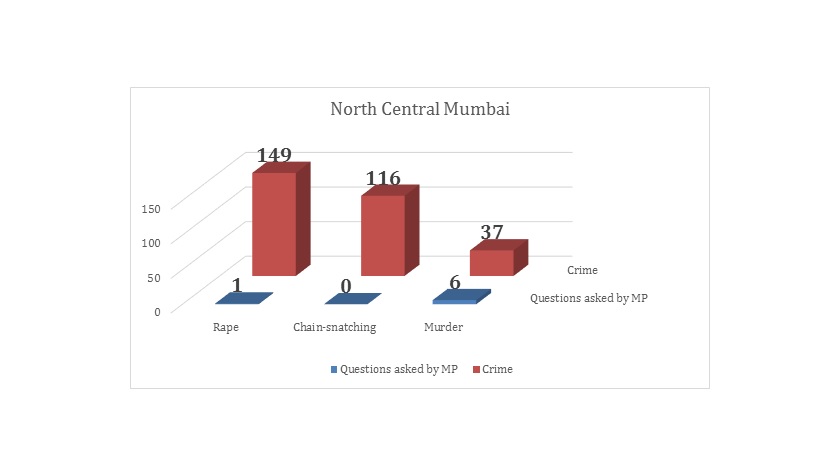
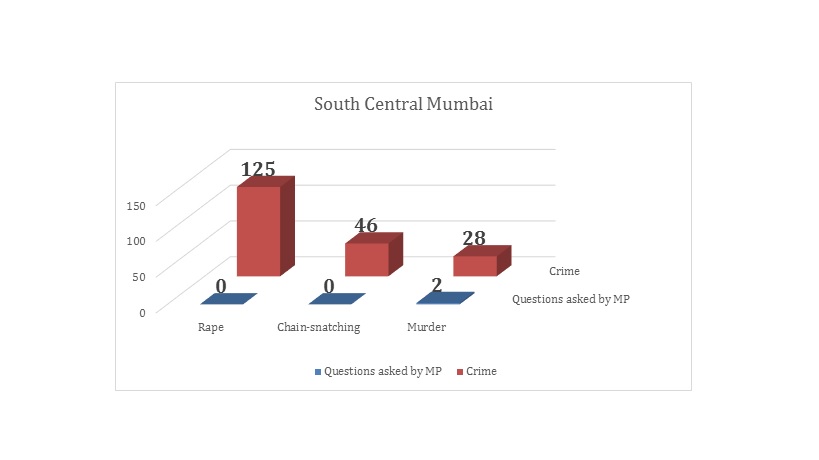
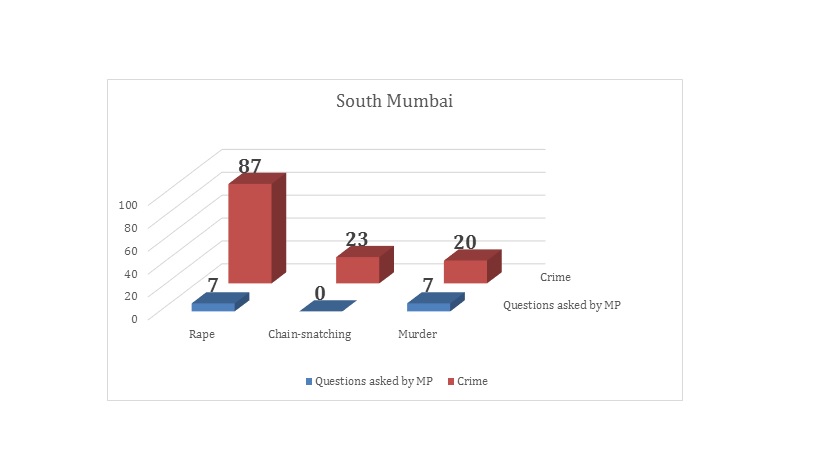
In almost all of the locailities, MLA’s ask few questions about rape even though it is one of the more frequently occurring crimes in the area. This data shows that though the MLAs have both the ability and the opportunity to ask pertinent questions about crimes that both occur frequently and the people are most concerned about, they instead ask few questions.